Skip to content

Logging the Tides: Make the CerboGX a Tide Station

  • by
crystal clear turqoise waters are the sea, with a tropical beach with green foliage and a big blue sky overhead with some white fluffy clouds

We recently upgraded our CerboGX to the latest MK2 model. The big selling point for us? The integrated CAN bus connection for a NMEA 2000 (N2k) network.

Is it a luxury? Absolutely. The CerboGX isn’t strictly required for our electrical system to function, but it’s become a key component in monitoring the boat. Beyond being a window into our power generation & consumption, its ability to run additional software opens up a world of customization.

The Problem: When Estimated Offsets Aren’t Enough

If you’ve cruised the Bahamas, you know the struggle: official tide tables are nonexistent for most areas, and there are few live tide stations. And it makes sense when you consider the infrastructure required to measure and report back on tides across the hundreds of islands across the Bahamas.

Thus, cruisers are left guessing based on estimated offsets from the official Nassau station (see our discussion about Current Cut in 2024). Given the wild variation in tidal ranges across the banks, guessing isn’t always a comfortable strategy. We rely heavily on recent local reports (e.g., the boat that just went through the cut ahead of us) or reviews that provide feedback on the estimated offsets (e.g., ActiveCaptain or NoForeignLand reviews).

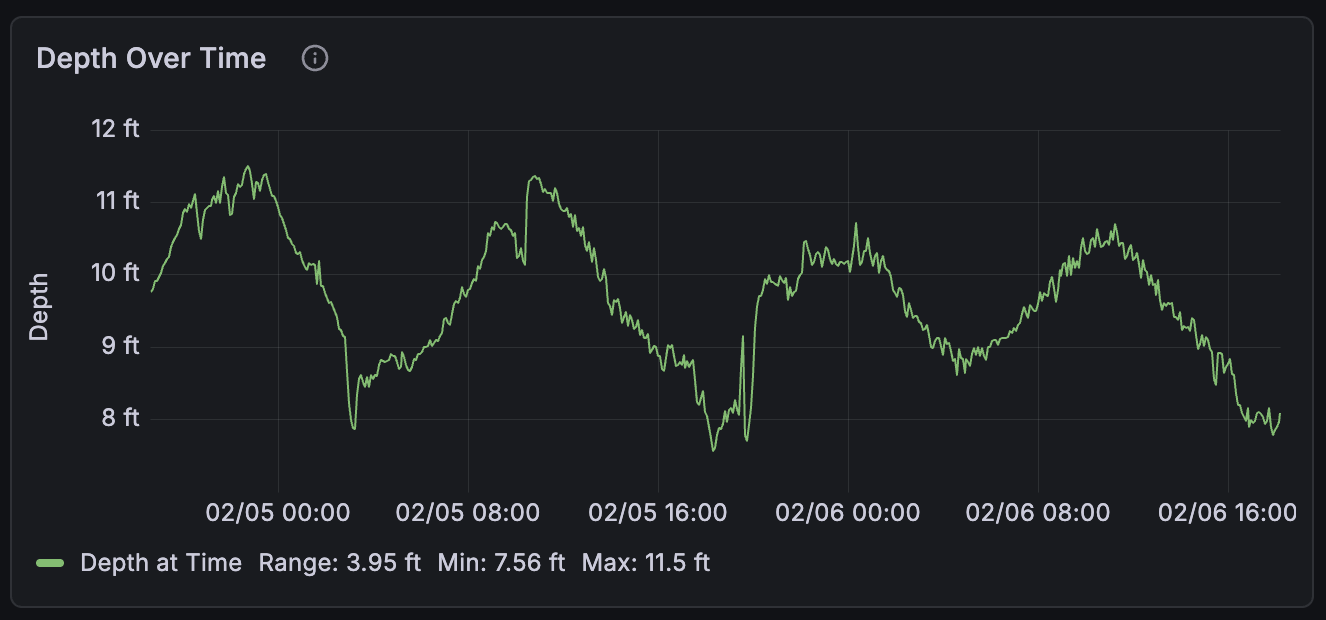
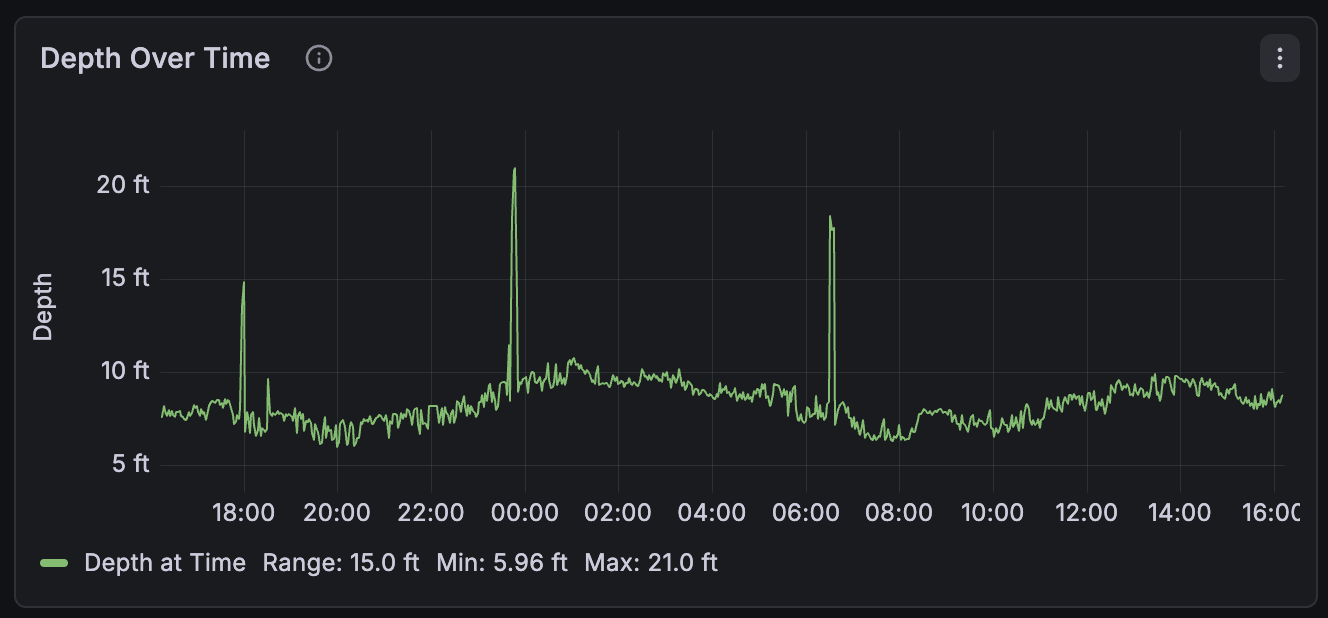
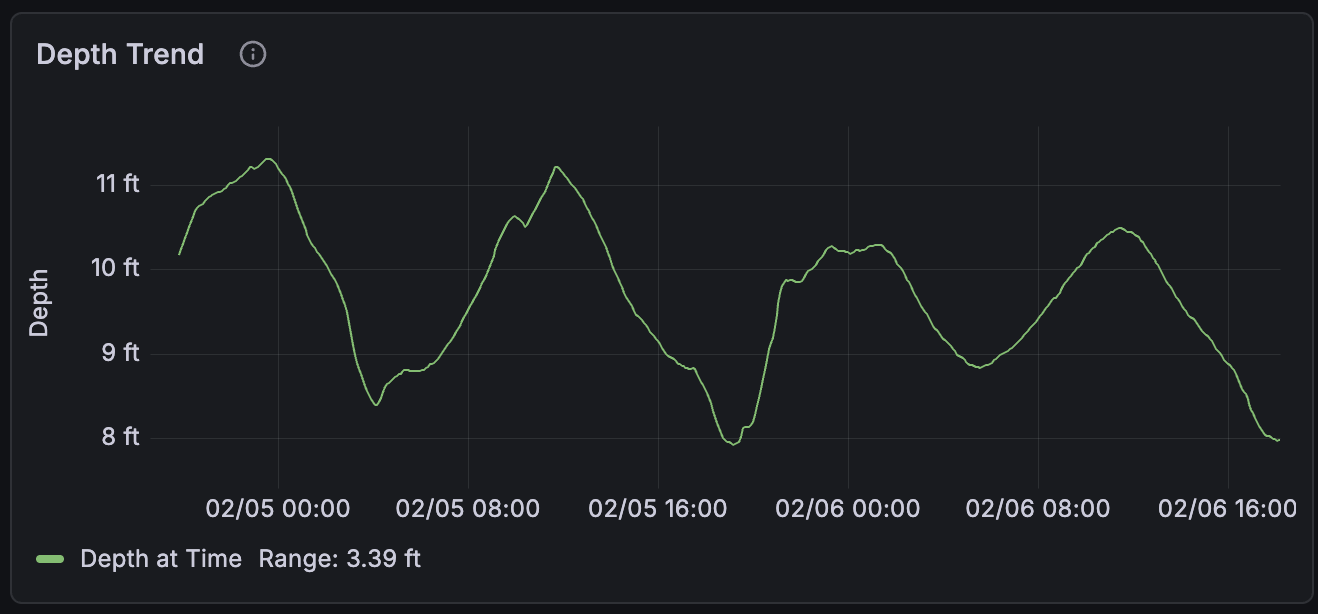
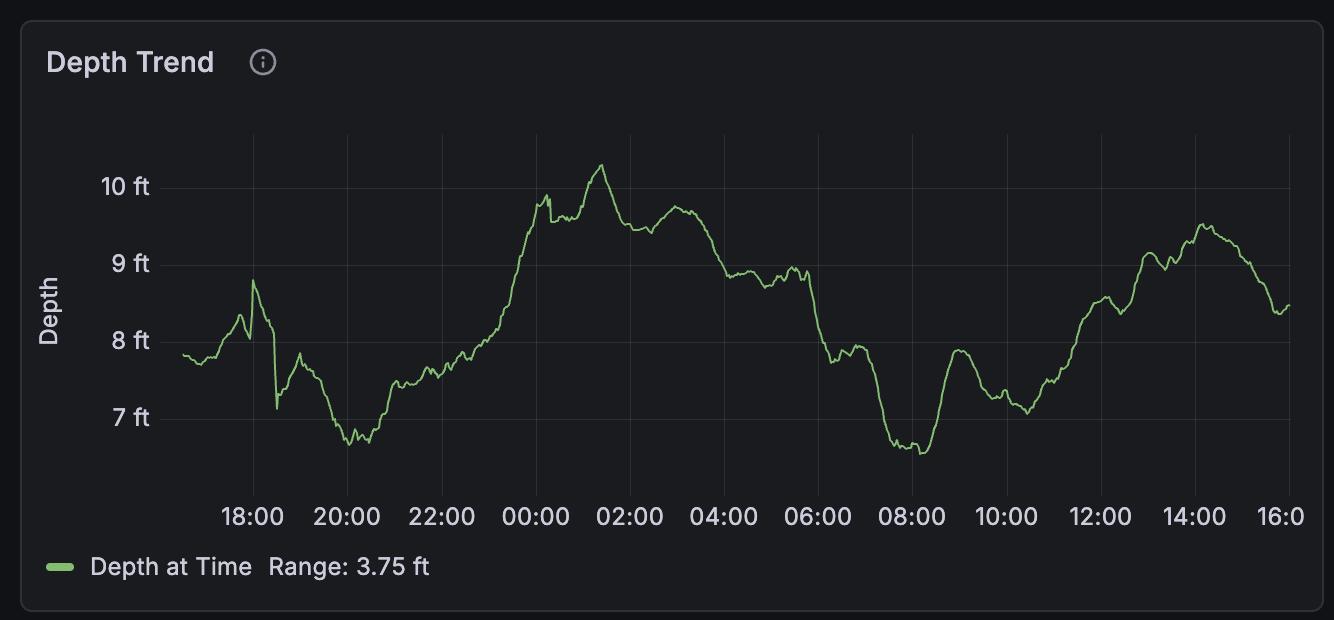
So, we thought: What if we calculated the local tides in our own anchorage using our own data? We become our own tide station. In the past, we have done this by periodically logging depths in our logbook, but manual processes inevitably fall by the wayside. We don’t take the time to write that down.

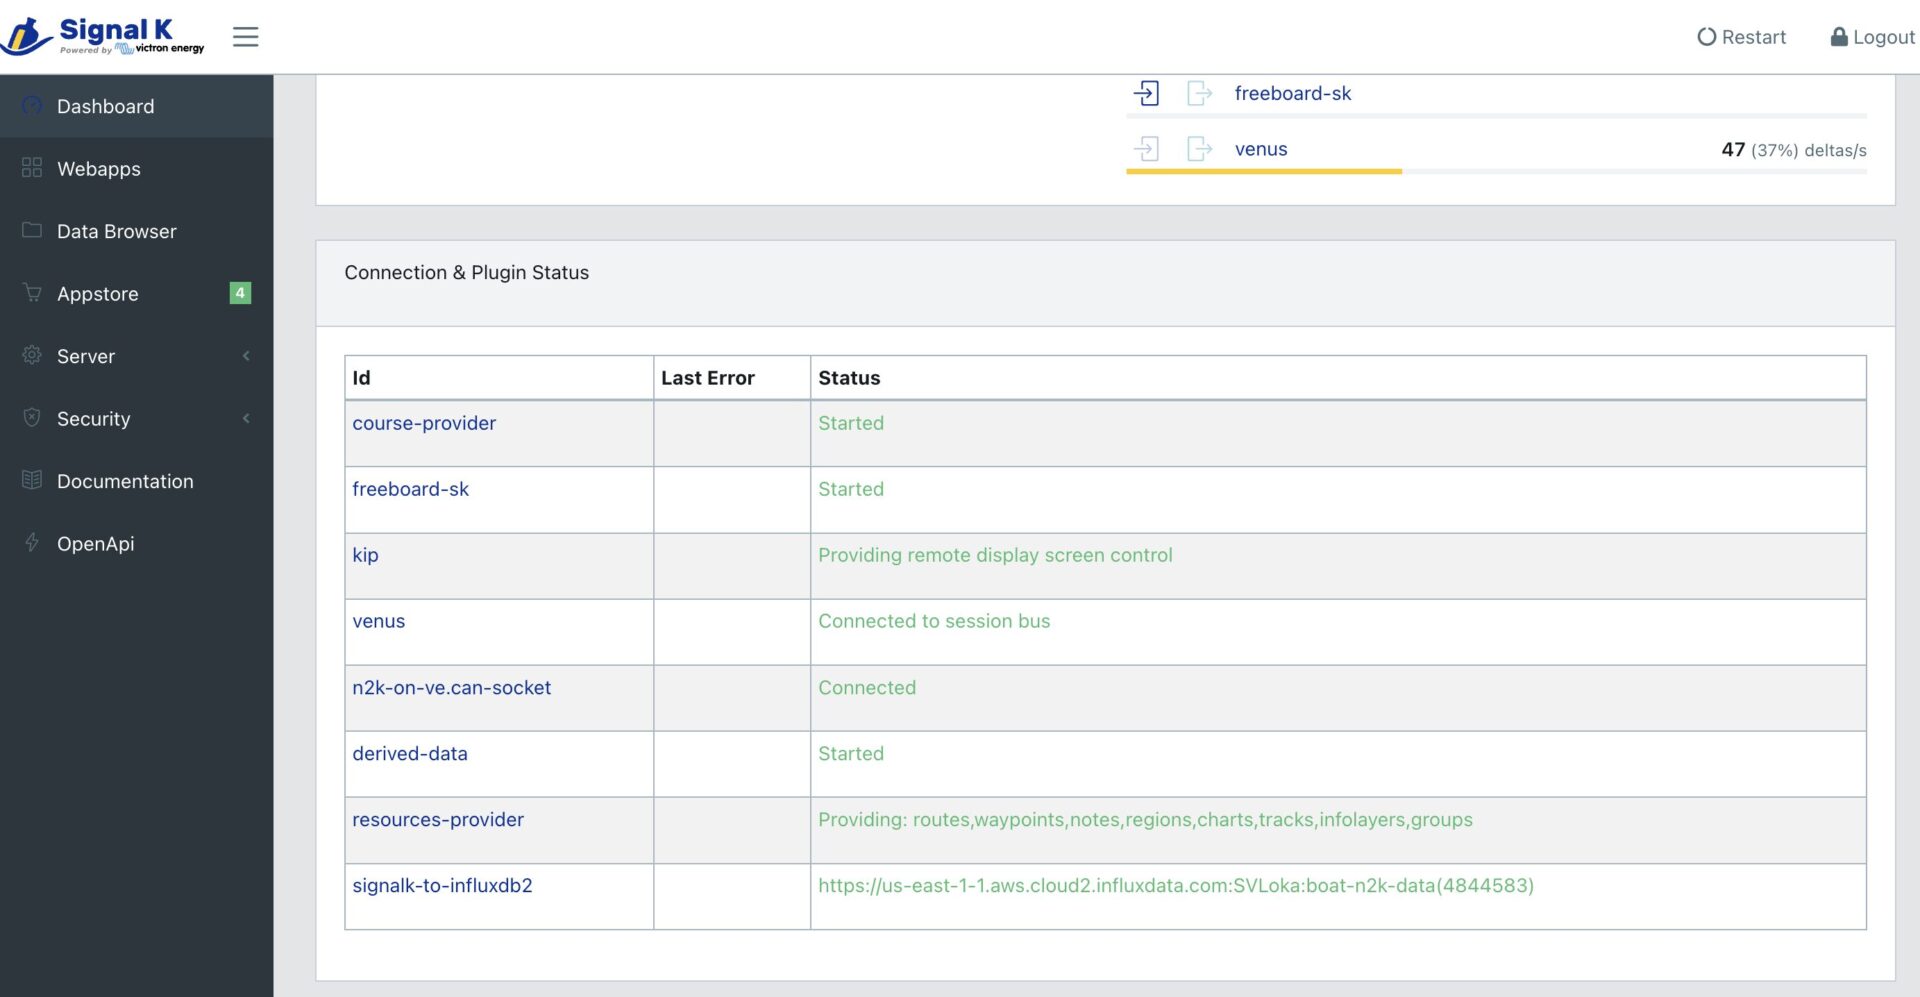
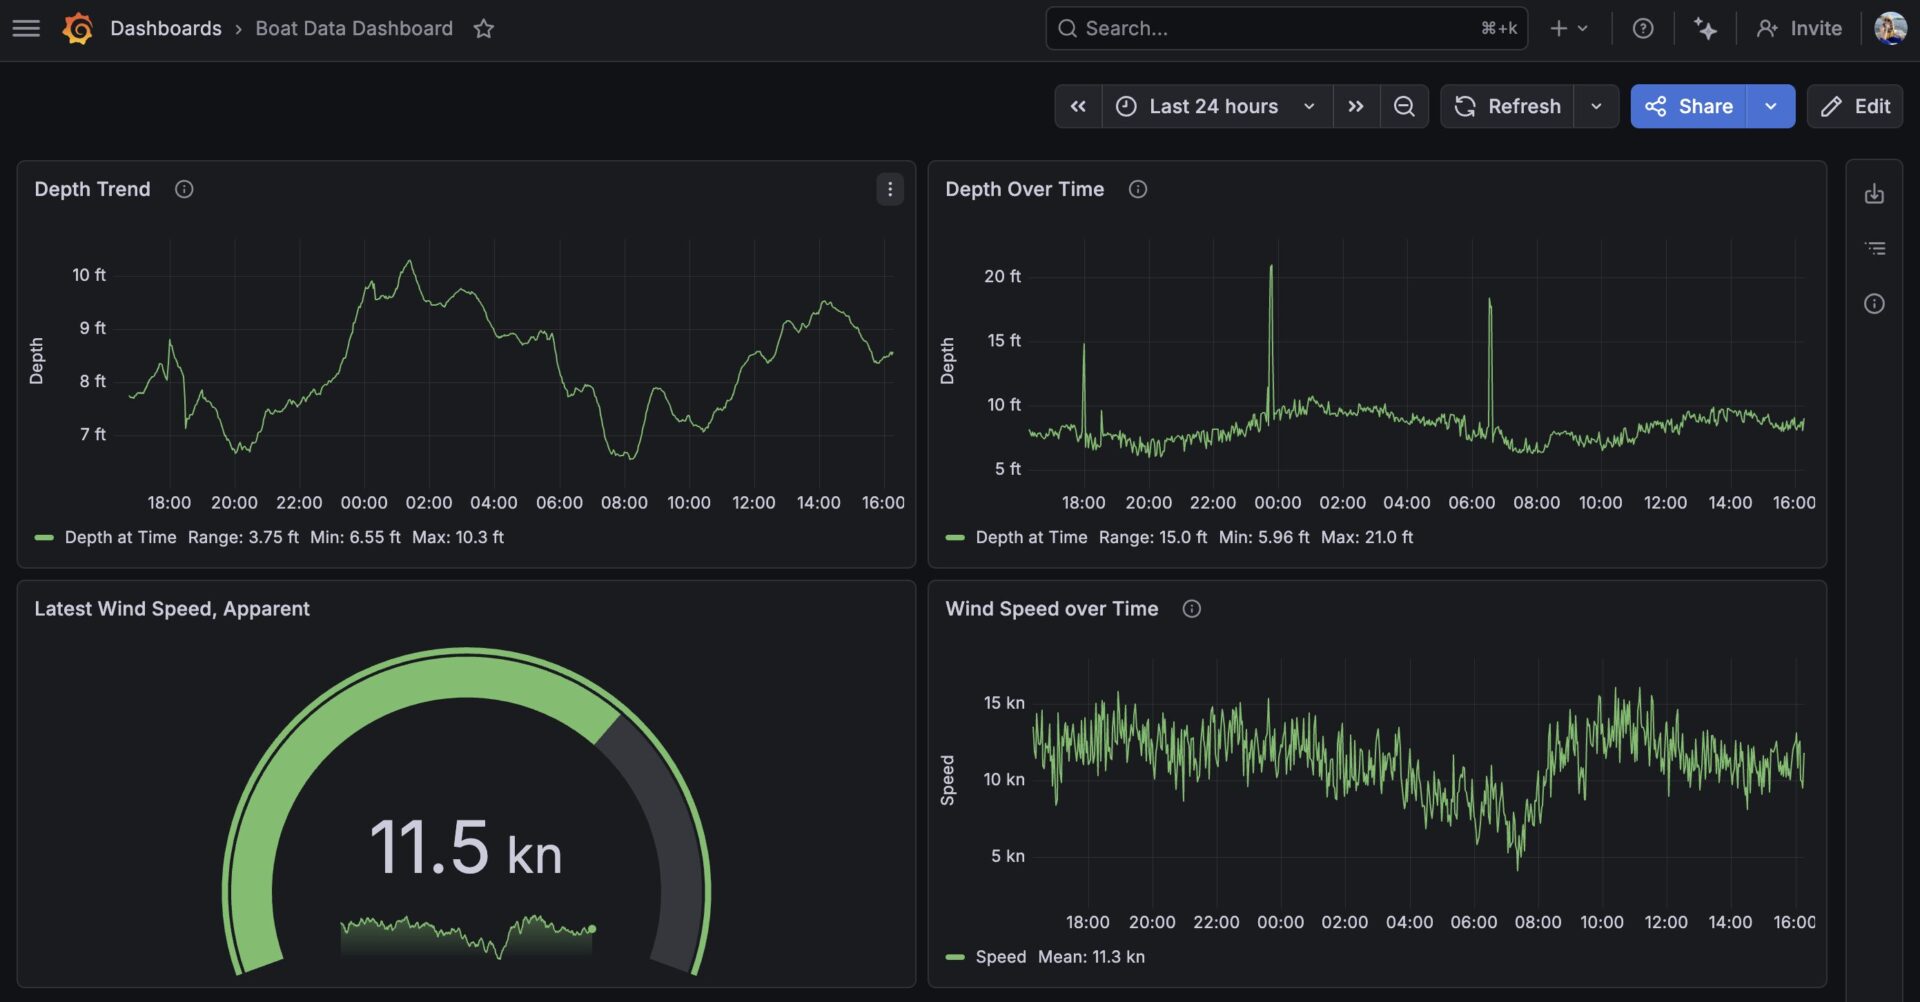
But we have sensors that are always on. Turns out, we have the technology! With a bit of configuration, we can turn our data points into a real-time local tide station using the luxury gadgets (i.e., the Cerbo and Starlink) we have on board.

a sailboat anchored in very stormy, turqoise waters with white caps and storm clouds overhead
SV Agora at Cambridge Cay during a wild front that brought 45k gusts and 35k sustained.

The Data Flow: From Transducer to Dashboard

I opted for a cloud-based setup because I didn’t want to add (or maintain) another physical device, such as a Raspberry Pi, to the boat’s network. If you prefer to host your own data on a local device, the steps below will be essentially the same, with obvious differences in which systems host your data. The concepts are largely the same.

The process is fairly straightforward, though I highly recommend reading the official SignalK documentation for Victron first. The steps below show how I pieced all of Loka’s components and services together. YMMV.

  1. The N2k Backbone: Ensure all your instruments (Depth, AIS, etc.) are active on your N2k network. If you have NMEA 0183, this process can still work (we have several 0183 devices connected to our 2000 network), but this post will not cover that. Check the Cerbo documentation for that.
  2. Hardware Connection: Plug the CerboGX MK2 into the N2k network. Run your cable cleanly!
    • Check the VE Can port for your N2k data. As of this writing, you can find it under Cerbo > Settings > Connectivity > VE.Can port 0 or 1 (ours is on 1)
    • Note: I had to disable “Broadcast to N2k” on our N2k VE.can port configuration on the Cerbo. It was causing conflicts that made our AIS targets go haywire (missing) on the chartplotter.
  3. Enable SignalK on Cerbo: Toggle the on in the Cerbo settings (see aforementioned Victron docs). As of this writing, the setting is on the Cerbo > Settings > Integrations screen.
  4. Configure SignalK Server: There are a few steps to ensure SignalK is working correctly.
    • By default, you’ll access the SignalK Server page by connecting to the same wifi network as your Cerbo and going to http://venus.local:3000 (or replace venus.local with the IP address of the Cerbo)
    • Setup an admin user! This isn’t obvious at first, but it is a good first step to securing your server.
    • Input your boat data (MMSI, name) on the server settings page. This enables a distinction between “self” data and other boat data (particularly by MMSI).
    • Under the n2k-on-ve.can-socket plugin settings, ensure the interface is set to WhateverYourCanIs (in our case, it was vecan1). The plugin should show a green status on the dashboard.
  5. Install the Data Capture Plugin: Add the signalk-influxdb plugin to your SignalK instance. View the plugin’s readme on GitHub.
  6. Create your InfluxDB database: Set up an InfluxDB instance either in the cloud (AWS) or on your local device. InfluxDB is a time-series database optimized for the constant stream of data coming from a boat.
    • You’ll need the host URL, organization, bucket name (your choice), and an API token.
    • Security note: I had to generate a token with MASTER access for the plugin to write correctly. I tried other, more limited roles, and got no data. I suspected this is because the plugin creates the data structures in addition to writing the data.
  7. Publish the Data: Configure the signalk-influxdb plugin with your credentials and database information.
    • A note on frequency: I started with a 1,000ms (1 second) collection interval, but eventually moved to 30,000ms (5 minutes) to save on data and storage. Five minutes feels like a good compromise for data transmission and frequency for a trend.
  8. Connect Grafana: Now you can configure your Grafana instance to report on data in the InfluxDB.
    • You’ll need the credentials and database info from step 6.
    • I used a live InfluxDB data source in Grafana rather than importing anything and keeping things simple.
    • I also continued to leverage the SignalK-to-InfluxDB readme on GitHub to configure it.
  9. Build the Dashboard: This is where the magic happens, and I elaborate below. I’m not going to elaborate on how to use Grafana (their docs are really good), but I will elaborate on what I did to get started.
a screenshot of a webpage that is the landing page of the signalk server
Make sure the plugins show as green on the first screen! The n2k plugins are especially important.

Making the Data Work for Us!

In a perfect world, a tide station stays perfectly still and measures depth at one specific point. In reality, because our tide station is a boat, it swings around the anchor on an uneven seafloor, creating variability in the depth data. This is where frequency matters, as well as your query refinement.

Initially, I used a basic query to pull the raw depth (note the conversion from meters to feet on Line 6) over a period of time. Note that v.timeRangeStart corresponds to the time range on the Grafana dashboard.

Here’s that query (in flux):

				
					from (bucket: "mybucket-data")
|> range(start: v.timeRangeStart)
|> filter(fn: (r) => r._measurement == "environment.depth.belowTransducer")
|> filter(fn: (r) => r._field == "value")
|> aggregateWindow(every: v.windowPeriod, fn: mean, createEmpty: false)
|> map(fn: (r) => ({ r with _value: r._value * 3.28084 }))
|> yield(name: "mean")
				
			
a line chart showing depths over time, very detailed so lots of data points, over 2 days
Depth Over Time - ~2 days in the Little Majors anchorage

We used this for about a week and immediately found value in knowing when the tides would flip and when the current might shift. While it was still a guess, we are at least making an educated guess now.

Then we landed in an anchorage (Little Farmer’s Cay) where we saw some outlier data that made our graph harder to decipher as a tide station. Somehow, the boat was floating over a deep spot, showing 18’ instead of the 7-10’ we had been seeing. I decided to handle that kind of deviation with a new query.

a line chart showing depths over time, very detailed so lots of data points
Depth Over Time - 24hrs in the Little Farmer's Cay anchorage

To get a cleaner “trend” that ignores outliers and boat swing, I refined the query to use a 15-point moving average to smooth the curve. This makes the high and low tide peaks much more obvious.

Here is that flux query:

				
					from(bucket: "mybucket-data")
  |> range(start: 2026-02-08T17:45:51.104Z, stop: 2026-02-09T17:45:51.104Z)
  |> filter(fn: (r) => r._measurement == "environment.depth.belowTransducer")
  |> filter(fn: (r) => r._field == "value")
  |> aggregateWindow(every: 2m0s, fn: mean, createEmpty: false)
  |> map(fn: (r) => ({ r with _value: r._value * 3.28084 }))
  |> filter(fn: (r) => r._value >= 5 and r._value <= 15) // Adjust based on local depth
  |> movingAverage(n: 15)
  |> yield(name: "trend")
				
			
a line chart showing depths trended so not as many data points and a smoother graph
Depth Trended - ~2 days in the Little Majors anchorage
a line chart showing depths trended so not as many data points and a smoother graph
Depth Trended - 24hrs in the Little Farmer's Cay anchorage

The Takeaway

This doesn’t solve the tide station problems unilaterally. It can’t tell you what the tide schedule is at a cut 5 miles away. It can’t help you with tides in that anchorage you want to check out. If you’re in a spot for only one night, this might just be a “cool to see” experiment. And clearly, some anchorages are more “flat” than others. 

That said, it could be useful if a cut nearby is roughly on the same schedule. If you’re waiting for a specific tide to exit a tricky cut or cross a shallow bank nearby, turning your boat into a tide station is a great way to leverage technology you may already have on your boat.

As a result of solving the tide station issue, our Grafana dashboard is slowly becoming a more comprehensive onshore monitoring tool. As long as the Starlink is up (or we have cell signal) and the instruments are on (our N2k network is on a separate breaker from our chartplotter), we can see exactly what Loka is feeling from anywhere in the world.

a dashboard showing multiple graphs with line charts and a gauge showing wind speed
The Loka Boat Data Dashboard as of Feb 2026, accessible on or off the boat!

Discover more from SV Loka

Subscribe to get the latest posts sent to your email.

Leave a Reply

Your email address will not be published. Required fields are marked *

This site uses Akismet to reduce spam. Learn how your comment data is processed.